Statements, prices and costs
A statement is what your organization's usage cost in one calendar month, at NubeStack's published rates. It is not an invoice: invoices come separately, and while statements are marked Provisional — not an invoice, the invoice is the one that counts.
Owners, admins and the billing role see them, and anyone with a custom role that includes seeing the monthly statements.
Statements
In the organization, open Billing → Statements and pick the month at the top right. All months lists every statement with its state and total.
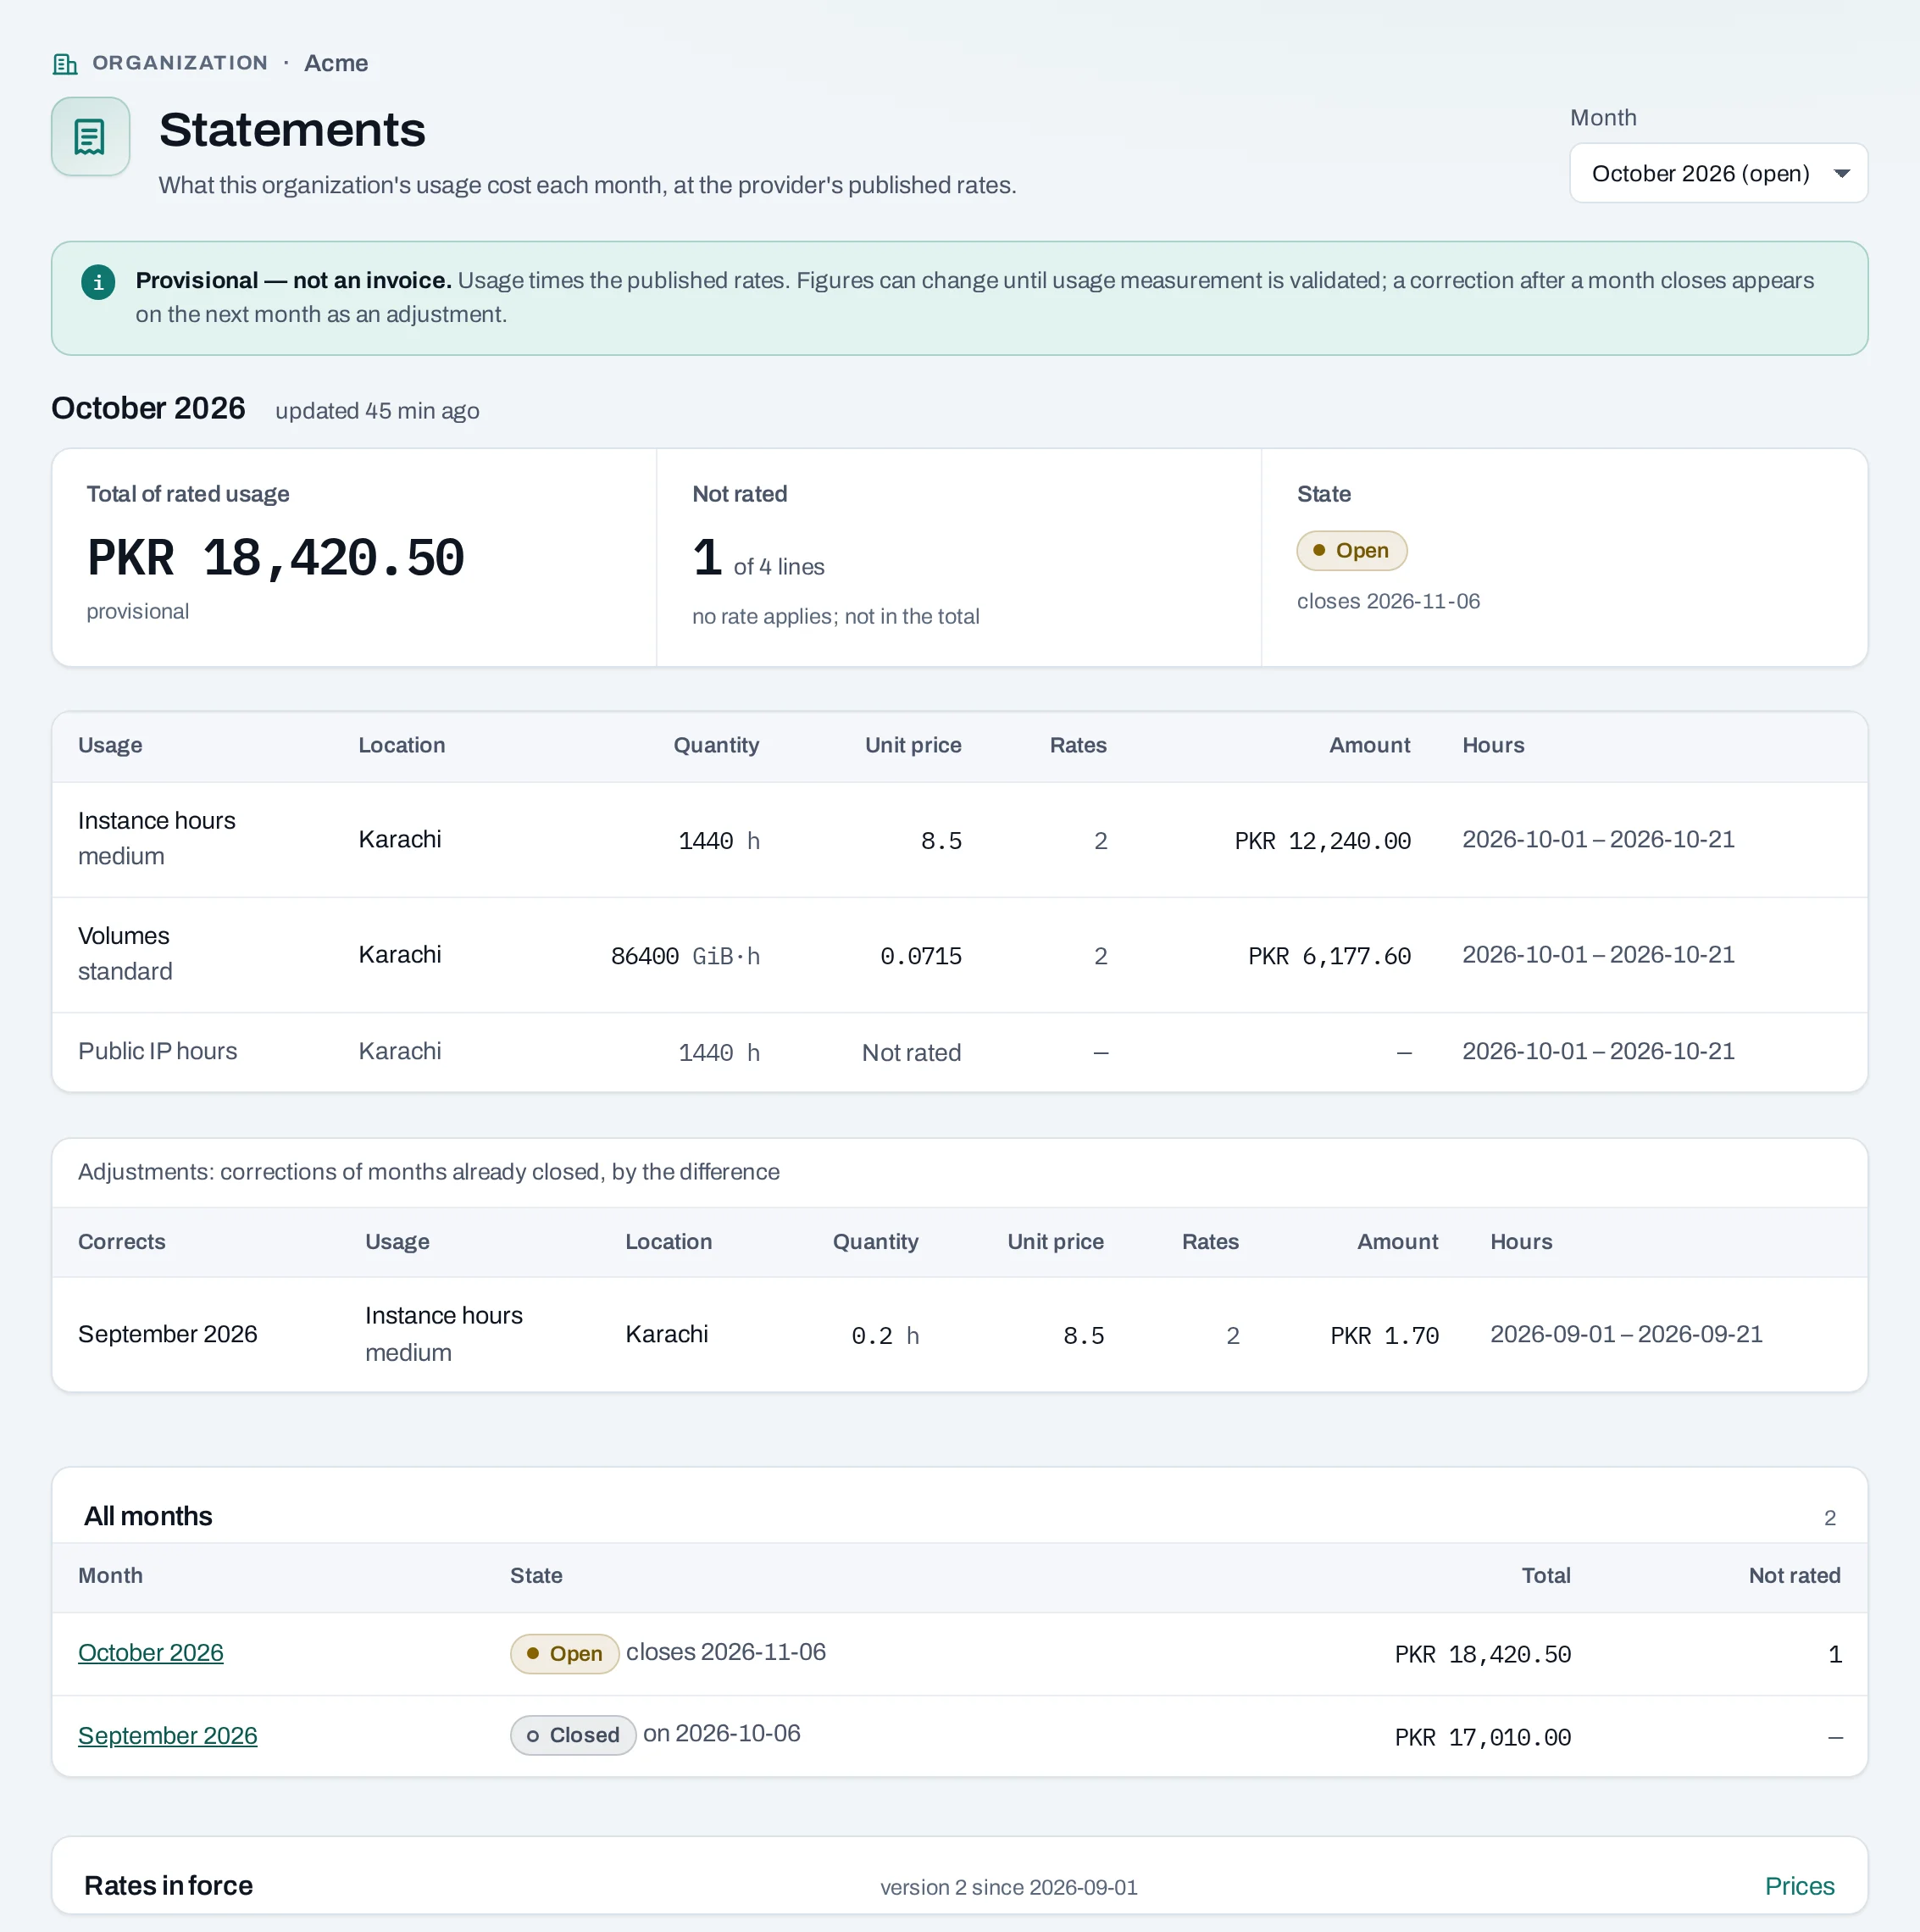
- Total of rated usage: every rated line, in NubeStack's currency, shown to the cent.
- Not rated: usage no rate covers, shown with its quantity and no amount. It is never shown as free and is not in the total.
- State: Open while the month runs and for five days after; then Closed, and it never changes.
- One line per measure and location, and for instances, volumes and load balancers per size or volume type: quantity, unit price, rates version, amount and days.
- Corrections to an open month change its statement. A correction to a closed month appears on the next open statement as an adjustment, which can be negative.
- Hours not counted: the month's usage that has not been measured yet, so is not on the statement. See Usage.
- Rates in force, at the bottom: the rate card's version, the next scheduled change, and a link to Prices.
Before NubeStack publishes a rate card, the page says No statements yet.
Prices
Billing → Prices shows what each kind of usage costs: NubeStack's rate card in force, and its next published change. A price for one size names the size, volume type or load balancer type as the create pages show it, and applies wherever that is offered.
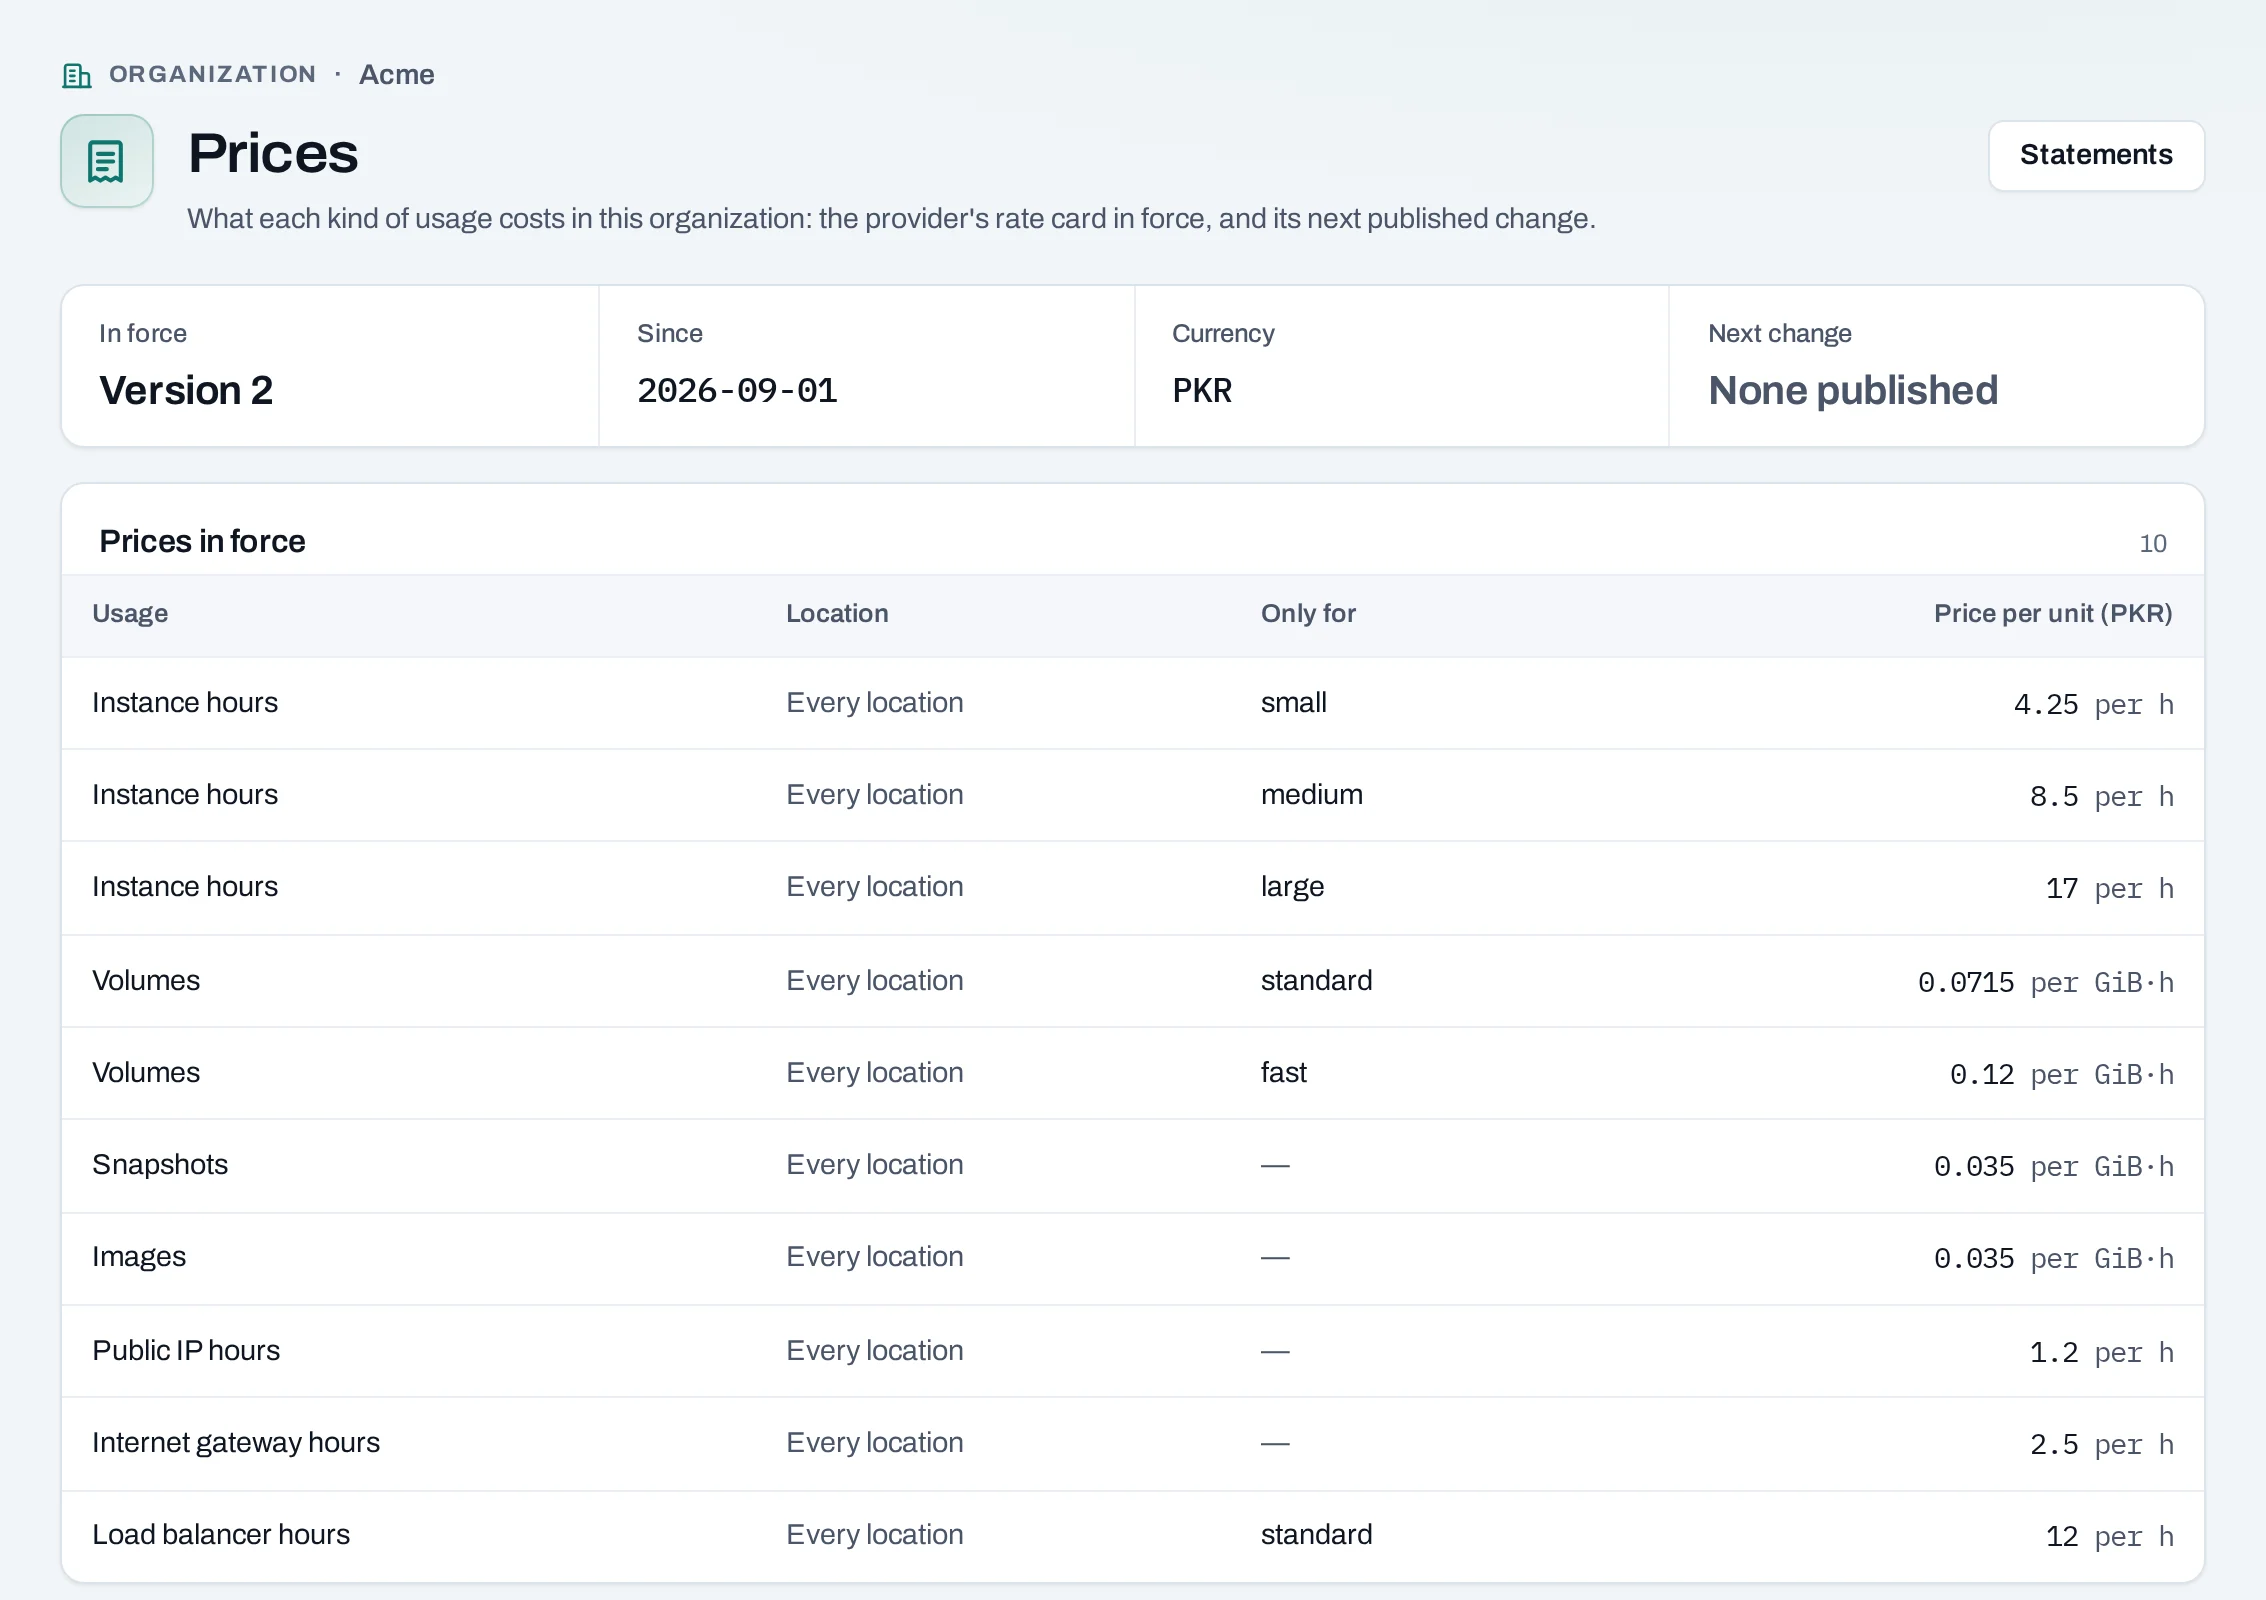
The same rates give the price estimate on the console's create pages, and the rate in the Internet gateway and snapshot dialogs.
Cost explorer
Billing → Cost explorer shows where the money goes: the month's cost so far by Project, Service, Location or Tag, as a bar for each day. In a project, the same page shows that project's cost.
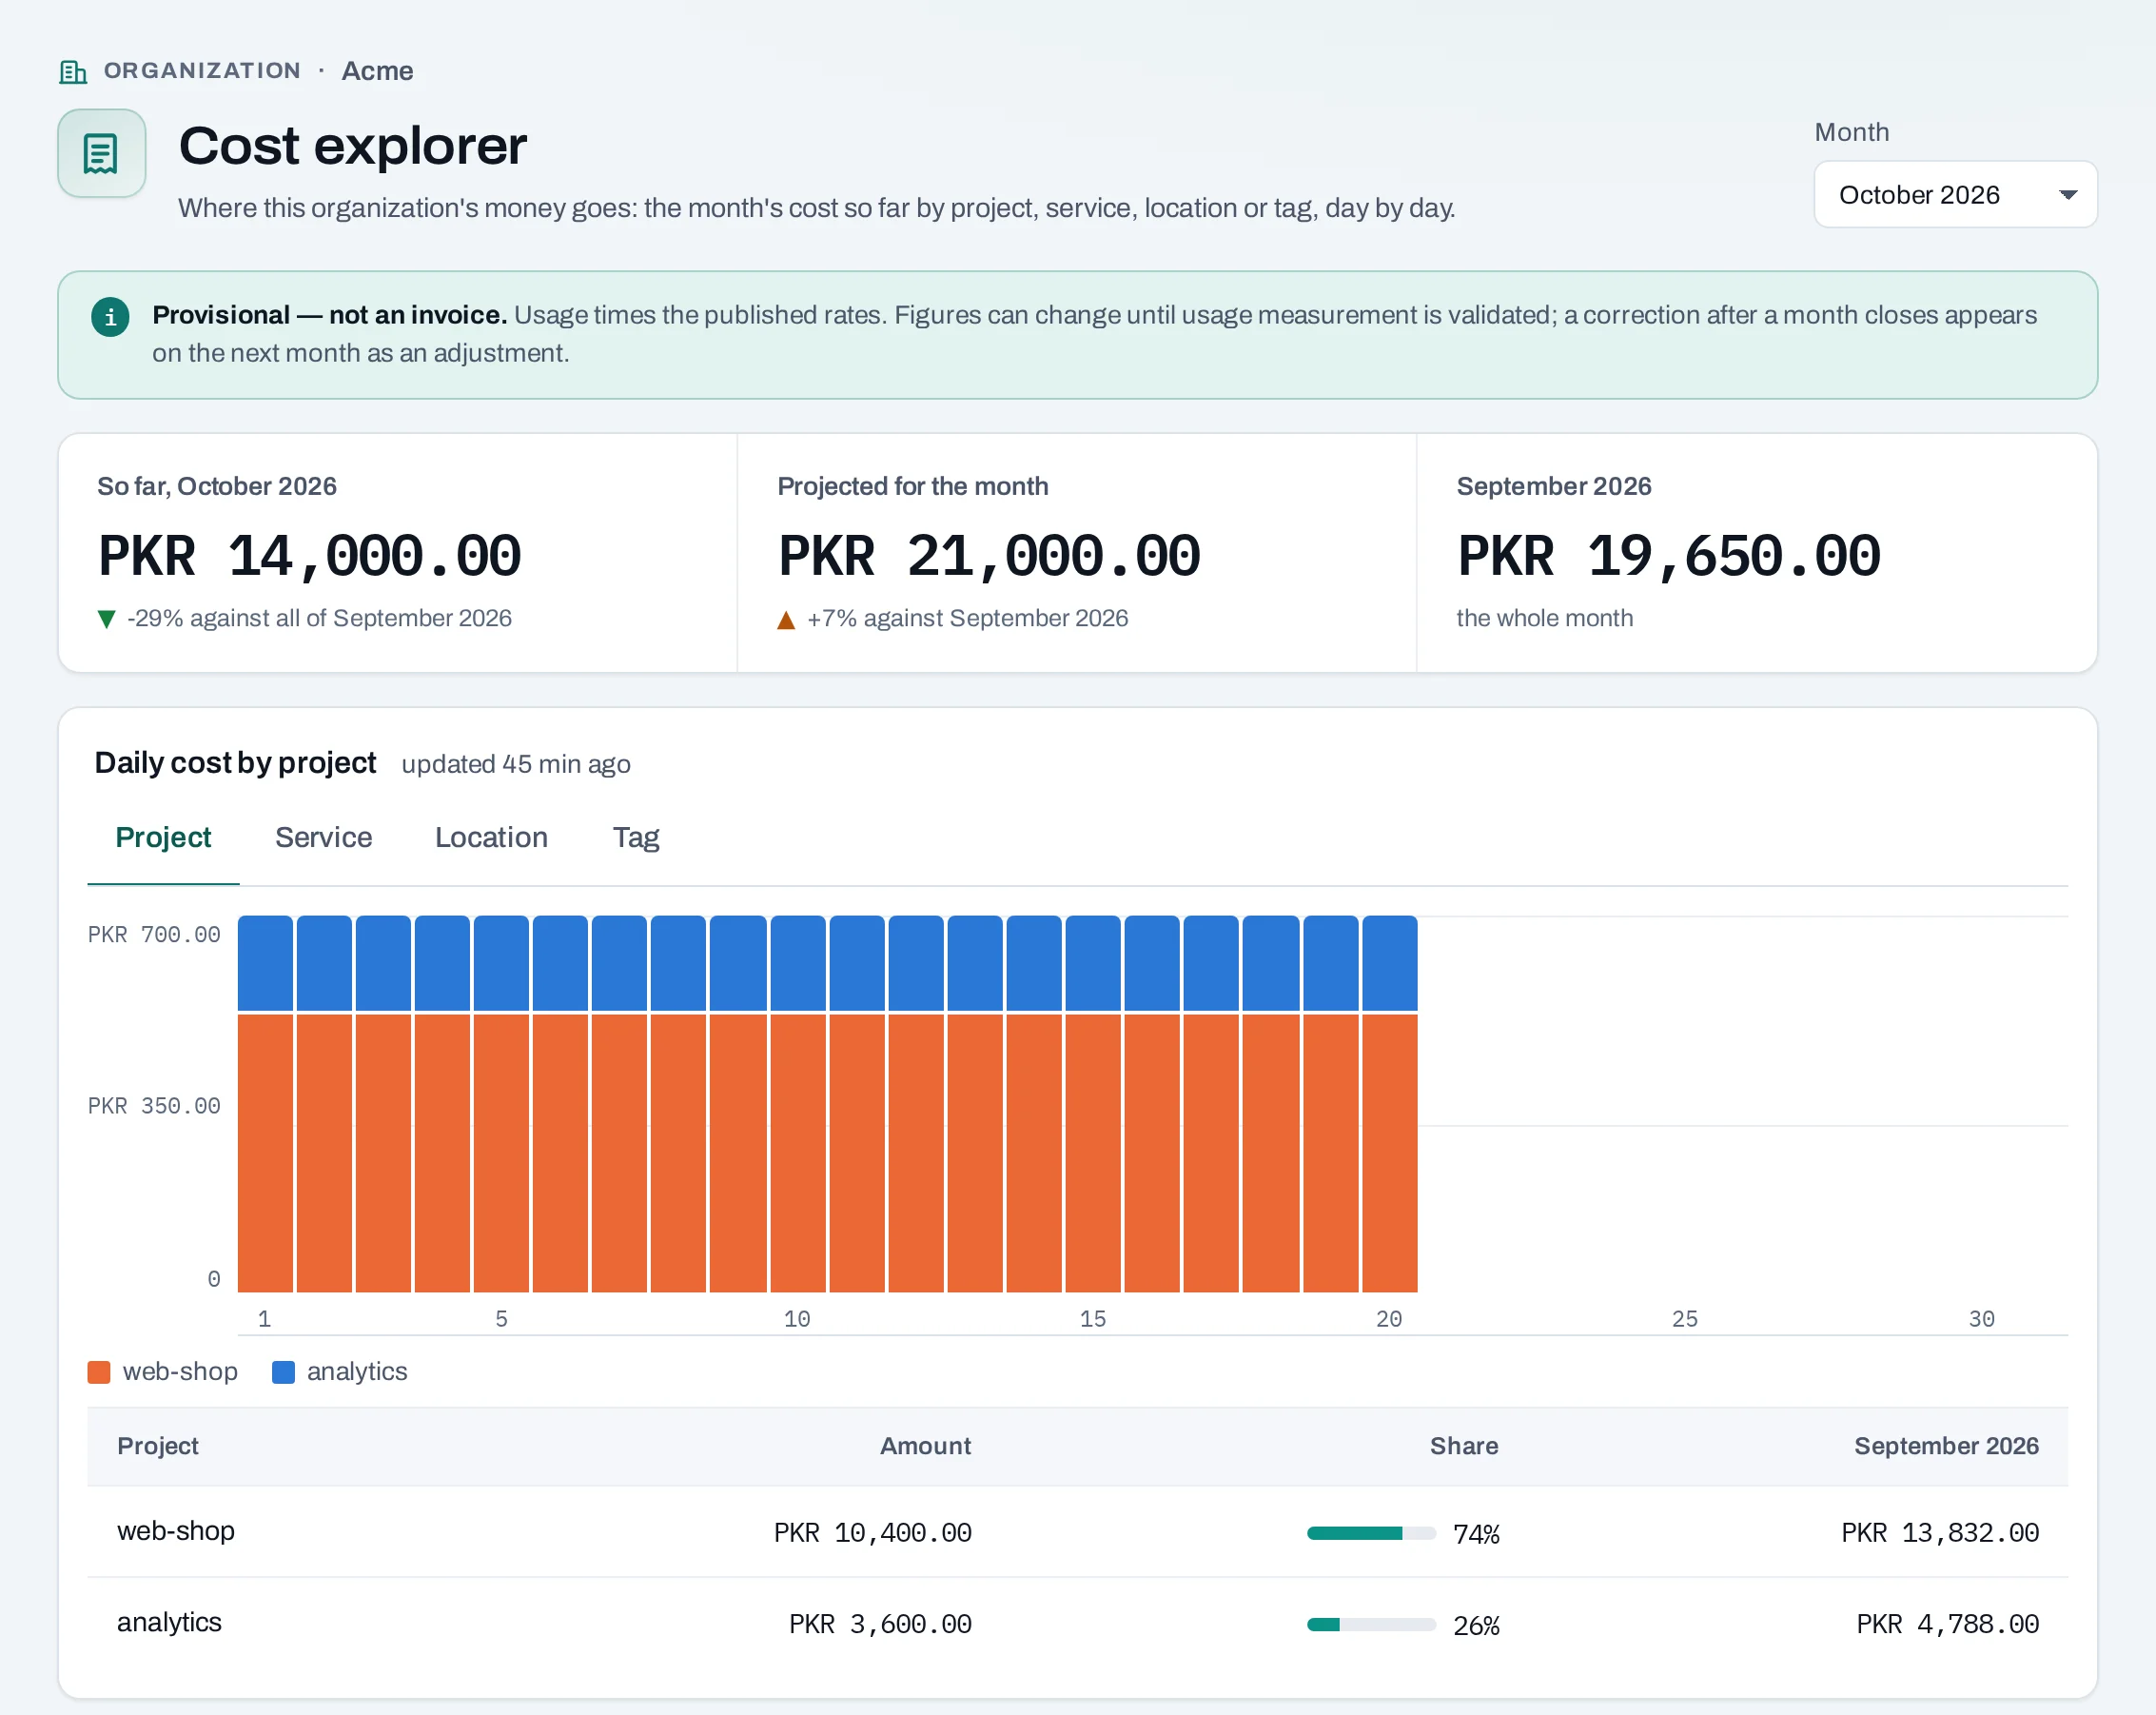
- At the top: the total so far, Projected for the month (the cost so far plus the average of the last seven full days for each day left, from the third day) and last month's total.
- Tag groups cost by one tag key's values, with resources without that key as Untagged. See Tags.
- Usage no rate covers is listed above the chart, never counted as free.
- A month's daily costs add up to its statement's total.
Through the API
| What | Route |
|---|---|
| Statements, newest first | GET /v1/orgs/{org_id}/statements |
| One statement with its lines | GET /v1/orgs/{org_id}/statements/{statement_id} |
| The usage behind a line | GET /v1/orgs/{org_id}/statements/{statement_id}/lines/{line_id}/usage |
| The rates in force | GET /v1/orgs/{org_id}/rate-card |
| A month's cost by day | GET /v1/orgs/{org_id}/costs?period=2026-10&group_by=project |
Amounts, prices and quantities are decimal strings.
Related
- Usage · Usage and costs · Tags